
Ashley Paul Mundaden
Software Developer
KNN Classifier with k-FCV
What is KNN?
How does KNN work?
KNN Algorithm takes as input an un-labelled record for which it needs to predict the label, then calculates its distance with all the labelled records in the training dataset, depending on the number of k it will retrieve the top k records from the training dataset that have the lowest distance to the input record. It will then choose the label that occurs the highest number of times from those k records and returns that label as its prediction.
k-FCV which stands for k-Fold Cross Validation is a resampling procedure used to evaluate machine learning models on a limited data sample. It has parameter k which signifies how many parts do we need to divide the dataset into. For example, if we set the k=5 it will divide the dataset into 5 equal parts. It would then run the classification function 5 times using each of these equal parts as the test data each time. The result of the k-FCV is often the mean of the all the test dataset’s accuracy scores
I started off my implementation by first understanding how KNN works and how should I implement it on the 3 datasets namely hayes-roth, cars and the breast cancer dataset that I have to work with in this article.
After getting a good grasp on how the KNN works I analyzed the datasets and found that I will definitely need to pre-process the datasets before I send them out to be classified. My code needs to accept any 1 of the three datasets at a time and should be ablet to classify them. In order for that I needed to write some functions in my code to handle a few anomalies in the data-set.
Pre-processing/Data preparation
The hayes-roth dataset was good to go from the beginning it had all numeric values in all the columns and the labels that were needed to be predicted was also a numeric label and it was the last column in the dataset


The cars dataset was where things started to get a little heated up, it had columns that had both string and integer values so I had to write a function that takes in the dataset and converts these columns to integers.Not just any integers, I assigned the same integer value to the same words in order to calculate this distance between rows later. The label column was the last column in the dataset

The breast cancer dataset was where all hell broke loose, It not just had columns of both string and integer values but the label column was also the first column in the dataset. I passed it first into the same function I created for the cars dataset to convert it to integer values and then tweaked the code a bit such that whenever it’s processing the breast-cancer dataset it needs to go to the end of the dataset
None of these datasets had any column headers to begin with and I had to dynamically add columns to the datasets while processing the data.
k-FCV implementation
After pre-processing my dataset, it looked super clean. I had dynamically added headers to it as well which made it ideal to work with using pandas. I used the Sci-kit library kFold function to divide my dataset into 10 folds. It can be done simply like this,
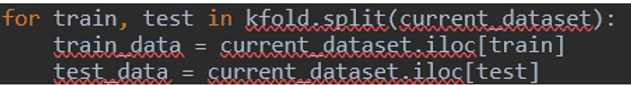
(Disclaimer: I just used sklearn to split the dataset, everything else was implemented from scratch)
After retrieving the datasets, I fed it into my classifier function where all the magic happens.
I would make sure that my classifier function would return the acucracy back so I can calculate the mean of the accuracy values of each of the datasets and can make a decision on how effective my classifier is

KNN Classifier
In my KNN classifier I first iterated my test Dataset so I can calculate the distance of each of the rows in the dataset with all the records in the training dataset.
In the for loop, I feed each of the rows in the generateDistanceMap() function that computes the distance of the test row with all the rows in the train datasets using 3 different distance formulas i.e. Euclidean distance, Manhattan Distance and Minkowski distance. The implementation for all the 3 distances has been written in my code but I use only one of them during the classification process.
After I retrieve the distance of all the records in the train dataset, I sort it in ascending order to get the records with the lowest value on top. Depending on what the k value is I extract the top k rows from this sorted list of records. I compare them and label that showed up the most in the top k rows will be the prediction values for that input.
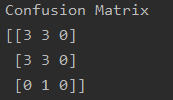
For each of the datasets I display (examples below, run code to see actual values),
The Accuracy,
The Error Rate,
The Confusion Matrix,
The Classification Report,

Results
I used a variety of k values to see different accuracy rates for each of them and came to the conclusion that k=7 best suits my datasets and I’ve gone ahead and used it in my results to compare the different distance metrics that I used in my code.
Using the k value as k=7 and doing a 10-fold Cross Validation
Hayes-Roth
Accuracy,
-
Euclidean Distance: 43.95604395604396
-
Manhattan Distance: 44.72527472527472
-
Minkowski Distance: 44.01098901098901
Comparison with sci-kit learn,
-
sci-kit: 39.395604395604394
Breast Cancer
Accuracy,
-
Euclidean Distance: 69.56896551724138
-
Manhattan Distance: 69.91379310344826
-
Minkowski Distance: 69.22413793103446
Comparison with sci-kit learn,
-
sci-kit: 69.21182266009853
Cars
Accuracy,
-
Euclidean Distance: 84.42835058475602
-
Manhattan Distance:
-
Minkowski Distance:
Comparison with sci-kit learn,
-
sci-kit: 93.40267509073802
As we can see, the accuracy rate for my model and the sci-kit library classifier function both obtain similar accuracy values for all the three data-sets. This is a reliable model.
In order to ensure that the code I’ve written is correct and the accuracy is the best accuracy one can get on these datasets using KNN I also implemented the KNN classifier using solely sci-kit libraries. I measured the datasets in the sci-kit library with the same value for k which is k=7 and with a 10-fold cross validation in order to get the accuracy that is almost the same as what my model achieved
References:
